Have you heard that one year of a dog's life is equal to seven years of a person's life?
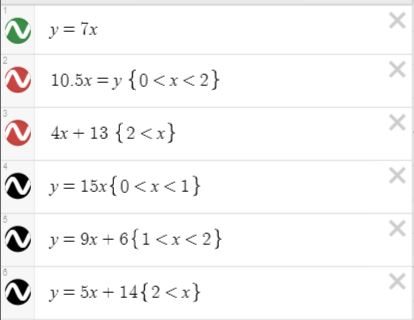
This would imply the following equation: y = 7x where x is the dog's age (in years) and y is the human age (in years). According to this site, "One explanation for how this formula got started is that the 7:1 ratio seems to have been based on the statistic that people lived to about 70, and dogs to about 10."
Using graph paper with your x scaled from 0-12 and y scaled from 0-84 (think about why these values for domain and range make sense), draw this line ( y = 7x) to represent a MODEL of the relationship between dog-years and human-years.
(An option other than graph paper is to use Desmos. Consider: you can plot human years on the x- axis and dog years on y-axis -- this is the inverse of the functions given here. Desmos can have you switch the x's and y's quite nicely should you want to do this. )
However, there's more to it than that. Dog development is different from human development. Even different breeds of dog develop at different rates. Below are two different additional models that compare a dog's age to a human's age.
This site has the following conversion: "For the first two years, a dog year is equal to 10.5 human years. After that, each dog year equals 4 human years. This calculation is based on studies that indicate dogs, except maybe larger breeds, develop more quickly in the first two years of life."
This implies a piecewise function to MODEL the relationship between the age of a dog and the age of a person: one function for 0<x<2 and a second function for 2<x, where x is the age of the dog. In the language and symbology of math:

Using the graph paper from the first model (with your x scaled from 0-12 and y scaled from 0-84 and containing the linear function already graphed), graph this piecewise function. This is a second, likely improved, model of the relationship between dog-years and human-years.
- 15 human years equals the first year of a medium-sized dog’s life.
- Year two for a dog equals about nine years for a human.
- And after that, each human year would be approximately five years for a dog.
Your task for this blog:
1. Identify the piecewise function that models the American Veterinary Medical Associations description of the relationship between a dog's age and a human's age (as described above in green with bullets). Again, don't let there be a breach in logic: this must be a continuous function.
2. Add this function to the graph paper that contains the other two models. Then choose three different dog ages and find how many "human years" is the age of the dog for each of the three models. (You'll be turning in this graph on paper on the due date for this blog; this is where desmos could really help you.)
AND, because there are always overachievers, you can expand your blog to include the following (or you can make your blog be the following):
3. Find another piecewise function in the Real World. It can be a different age conversion for dogs (or for cats). It can be how the power company bills for services. It can be a discussion of the examples used by Khan Academy or another site (DO credit your source.) Describe and explain the piecewise function and how it models what you've chosen Graph it, if that's necessary in your explanation, As always, find something that's fun for you.
OF COURSE, you'll need to (a) add this to your current blogsite and not create a new one. (b) turn in the blog accurately and carefully through canvas. Be sure I do NOT need a password to access the URL you give me. To do this, be sure you click on "view blog" prior to copying the URL. (c) If I send you a message through canvas that I can't read your blog, you MUST respond within 3 days or your grade will remain a 0