Monica Lewinsky gave an important TED talk.
Watch it. It's about 25 minutes long. There are many important messages here; please listen with your eyes opened. Ms Lewinsky is a brilliant and thoughtful woman with impressive speaking skills and a life experience from which we can learn much about our culture, about the era of electronic communications and about the torture of public humiliation.
Ms Lewinsky refers to herself as "Patient Zero" in cyberbullying. Over 20 years ago, information about her life changing event spread rapidly and internationally over the internet. Her image, along with negative labels and sordid stories and commentaries, was spread with never-seen-before speed. Her story was likely exaggerated through repetition (ever play "telephone" as a kid?) and carpeted the globe. Her name became household; she was recognized on the street and grocery store. She claims, likely accurately, to be the first to be publicly humiliated in this extreme manner and at a time before "cyberbullying" was a word. Since then, bullying on the internet has become lethal. Take a deep breath and process that idea, google if you'd like. We will now sanitize her heavy message and look at just the math.
So if you have not already watched her TED talk, then stop reading MY blog now, click on the link above to her TED talk, and watch her full talk. Then return to this page and continue.
Again, let's separate ourselves from her personal humiliation and look at the spread of information on the internet. We will start slowly, and with an unrealistically simple model to set the stage. Our first model will minimize the spread but will still illustrate how rapidly information is passed from person to person electronically. We'll put a name to this kind of growth. Let's start by working by hand. You'll need full-sized graphing paper , some regular lined paper for some work, and at least two writing implements of different colors. (The link will take you to free graph paper; you can choose your size. Choose Cartesian Graph Paper. Let your size be 85x11 inches. Choose millimeters. Measure in 5 cm units. You are lucky, though, I've copied some of this paper for you to use for this exercise. )
With a ruler or straightedge, darken a horizontal line one unit upwards from the bottom of your graph paper, oriented vertically. This will be your x axis. Each PAIR of blocks will represent an HOUR time interval. Then darken a vertical line one unit to the left of the left side of your paper. This will be your y axis. Each block will represent the number of new people who receives the information. Label your axes with words and with numbers; labeling will help you keep track.
The parameters we will set include a limitation that you all might agree is very conservative. Let's say that each time a person receives this juicy information, they forward this information -- a simple "click" -- to only 3 different people. Let's say that folks send on information not continuously or within seconds, but once each HOUR. (Ok, so in reality, it could be shared on any social media account where potentially HUNDREDS of people would learn the information with a single instantaneous "click," but we are working with a simpler and far more conservative model. We are starting by spreading the message slowly and to three additional people at a time. Do you agree that we are really really slowing down the spread of information?)
At time = 0 (x=0, therefore the y intercept), have 1 person know the information. Then after 1 hour (x = 1), that person "clicks" the mouse to send the information to 3 people (so the coordinate is (1,3) ) Then at t = 2 (2 hours later), those 3 people each send the information to 3 more people (so the coordinate is (2,9)) At 3 hours, each of those 9 people send the message to 3 more new people: the coordinate is then (3,27). On your lined, paper, make a chart that represents hours in one column and number of new people who receive the information in the second column. You'll want to use your calculator and likely round appropriately. Find the numbers for up to 15 hours. (Use scientific notation if you need to!) This is, remember, just over half a day.
When you are done with the chart, plot the points on your graph paper. You might have trouble plotting some of the points on this single graph paper. You have nearly 40 blocks on the x axis, so you can represent 18 hours on your graph; let your chart be complete for each hour up to 15 hours. Record your observations, in writing. Here's the start of your blog.
Then find an equation that fits your data points. (in the form y = _______) Of course, Khan Academy parallels what we are doing nearly perfectly in a two minute video. In this video, you'll learn the name of these kinds of relations. So if you have not already watched Sal Khan in the video link above, stop reading this blog now and watch the Khan Academy lesson now then return to this page to continue. Be sure your BLOG TITLE includes the name of these relations. (Hint: begins with "e.")
Now let's adjust a single parameter. What if information is transferred only once each hour, but instead of only 3 people getting the information, 10 people receive the information? (This is still pretty conservative, in light of the fact that each "click" could spread the information to hundreds of your friends.) Re-do your chart on your paper. Plot the new points on your graph in a different color. Find the equation that fits your data points. Record your observations.
By now, you likely get the idea. What would happen if information was passed on -- more realistically -- once every 15 seconds? What if information was passed on to 100 new people with each "click" each person makes? How does the graph change for each adjustment? Report your understanding in your blog. Be expansive and thoughtful and creative. At some point, we can cease to understand the magnitude of the numbers our calculator reports: the numbers are simply too large.
On February 21 (Feb 22 for period 4), I will collect your charts and graphs and expect your blogs to be uploaded into canvas.
Our next blog will consider a different graphing strategy so we can graph more information about the large numbers that appear in these functions.
Wednesday, February 8, 2017
Tuesday, January 3, 2017
Math Humor January, 2017 for all classes.
"Irrational people," says Mr Z, "hate this site." Look at the site just for kicks. It highlights the positive integers under 30. As the site says, "Now more than ever," is this important. As I scrolled through the site, I found myself chuckling and enjoying the relationship between what we do in class and what I was seeing on the screen.
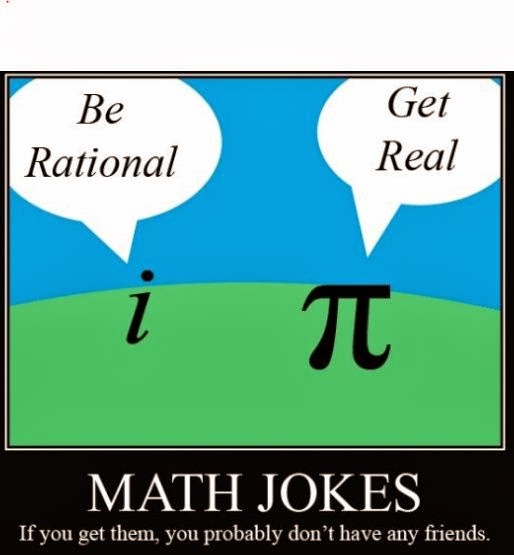
Then of course, there's more jokes within the same realm of sets of numbers:
Then, of course, there's the cute play on symbols:
And I always need to put in a plug for why you need to take math:
Welcome to the new year. Find me some good math jokes; extra brownie points are given to those who find ones about the current topic.
One point for each piece of math humor. Go ahead, pull them from pinterest or wherever you find them. Have fun.
Monday, October 31, 2016
Pick's Theorem
In 1899, a man named George Alexander Pick discovered a new and very different method of finding the area of a polygon. This could be ANY polygon, as long as it can be placed on the Cartesian Plane and each of the vertices has coordinates that are integers.
His formula? Let "i" be the number of lattice points (where the grid lines intersect on the coordinate plane) on the interior of the shape; let "b" be the number of boundary points (where the grid lines fall on the sides of the polygon), then Area = i + (b/2) -1.
For example, the green triangle has 4 interior points and 4 boundary points (vertices are included as boundary points). The area is 4+(4/2)-1=5, Another way to calculate area would help us verify this answer for area. We could verify this area found by Pick's Theorem by taking the 3x4 rectangle that completely encompasses the green triangle and subtract the three right triangle areas.
(12) - (1/2) 2x2 - (1/2)2x3 - (1/2)1x4 = 5. (Note: using our area estimation algorithm from class only gives an estimate, not necessarily an exact value, so don't use that method here.)
Find the areas in TWO ways (Pick's thm and one other -- either rectifying or subtraction from a larger rectangle) shown in the previous paragraph of the remaining colored polygons.
His formula? Let "i" be the number of lattice points (where the grid lines intersect on the coordinate plane) on the interior of the shape; let "b" be the number of boundary points (where the grid lines fall on the sides of the polygon), then Area = i + (b/2) -1.
For example, the green triangle has 4 interior points and 4 boundary points (vertices are included as boundary points). The area is 4+(4/2)-1=5, Another way to calculate area would help us verify this answer for area. We could verify this area found by Pick's Theorem by taking the 3x4 rectangle that completely encompasses the green triangle and subtract the three right triangle areas.
(12) - (1/2) 2x2 - (1/2)2x3 - (1/2)1x4 = 5. (Note: using our area estimation algorithm from class only gives an estimate, not necessarily an exact value, so don't use that method here.)
Find the areas in TWO ways (Pick's thm and one other -- either rectifying or subtraction from a larger rectangle) shown in the previous paragraph of the remaining colored polygons.
More for practice and deeper understanding:
Now use the illustration below to find the areas of regions A, Q and R. Verify that A = Q + R.
Now, for your blog, find the areas outlined above using Pick's Theorem (yes, all of them) and verify them using techniques you have learned in class. THEN, go to this website to see what happens that's interesting when you use Pick's Theorem to find areas of regions with "holes" in them. Feel free to comment on the similarity between the proof of Pick's Theorem and how we found the areas of triangles placed on the coordinate plane in class.
Remember your blog must be STAND ALONE. Do not require your reader to read Jammnpeaches to know what's going on in your blog.
G. A. Pick died in a concentration camp in about 1943.
Sources:
http://www.cut-the-knot.org/ctk/Pick.shtml
https://en.wikipedia.org/wiki/Pick%27s_theorem
http://jwilson.coe.uga.edu/emat6680fa05/schultz/6690/pick/pick_main.htm
https://nrich.maths.org/1867
Sunday, October 9, 2016
Proving Trig Identites
You have in your possession an amazing tool called your graphing calculator. While the TI 84 can't do algebra for you (but there are "CAS" algebra systems on calculators....just not allowed on your standardized tests), the TI 84 can help you simplify or verify identities using the graphing application of the calculator.
Let's start with those exercises where you need to "simplify" a trig statement.
The idea: if you are looking at one of those trig statements that looks crazy busy and are not sure where to go, sometimes it's easier to work through finding the answer (that is, writing the *solution*) if you know the answer. But darned it if the teachers want you to "show your work" and not just guess, so you still need to do that algebra to the trig functions. So how can you find the answer so you can be helped to find the solution?
Let's say you are asked to simplify: (sinx+cosx)^2-2secxcscx and you don't know where to start.
Type the expression into Y1, then graph. You'll want to be conscious of what mode you want to consider; but you'll find that the graph of this expression is simply a horizontal line at y = 1. That information suggests to you that the expression simplifies to 1.

Now how about proving trig identities?
To review the definition of identity: An equation that is true for ALL values of the variables; not just one or two, but for all values of "x."
Perhaps you've been trying to prove an identity and have found yourself in algebra hell for a while and you're not sure if the equation is an identity after all. How might your calculator help determine if your teacher or the text made a mistake?
This is your question to answer for your blog. Start with the following link:
http://mathbits.com/MathBits/TISection/Trig/trigidentity.htm
In your blog, find an equation that is NOT an identity. It could be an equation with one or more solutions or it could be an equation with no solutions. Show how your calculator would disprove the equation as an identity. Be creative. Have fun.
Then find your own identity to use. Use the basic identities or the Pythagorean identities to help you find one. Again, be creative. Show how you would use your calculator to strongly suggest that the statement IS an identity. Notice my change in wording... Can't you use your calculator's graphing (or tables) tools to prove that an equation is an identity? You'll need to address that also.
In sum:
a. Find an equation that is not an identity. Use your calculator to demonstrate that it's not an identity. Be creative. Take screen shots, pictures, images, etc.
b. Find an identity. Use your calculator to show what an identity looks like on the screen. Be creative. Take screen shots, pictures, images,etc.
c. Why can you not prove an identity using the graphing or tables tools? Explain.
Let's start with those exercises where you need to "simplify" a trig statement.
The idea: if you are looking at one of those trig statements that looks crazy busy and are not sure where to go, sometimes it's easier to work through finding the answer (that is, writing the *solution*) if you know the answer. But darned it if the teachers want you to "show your work" and not just guess, so you still need to do that algebra to the trig functions. So how can you find the answer so you can be helped to find the solution?
Let's say you are asked to simplify: (sinx+cosx)^2-2secxcscx and you don't know where to start.
Type the expression into Y1, then graph. You'll want to be conscious of what mode you want to consider; but you'll find that the graph of this expression is simply a horizontal line at y = 1. That information suggests to you that the expression simplifies to 1.
Now how about proving trig identities?
To review the definition of identity: An equation that is true for ALL values of the variables; not just one or two, but for all values of "x."
Perhaps you've been trying to prove an identity and have found yourself in algebra hell for a while and you're not sure if the equation is an identity after all. How might your calculator help determine if your teacher or the text made a mistake?
This is your question to answer for your blog. Start with the following link:
http://mathbits.com/MathBits/TISection/Trig/trigidentity.htm
In your blog, find an equation that is NOT an identity. It could be an equation with one or more solutions or it could be an equation with no solutions. Show how your calculator would disprove the equation as an identity. Be creative. Have fun.
Then find your own identity to use. Use the basic identities or the Pythagorean identities to help you find one. Again, be creative. Show how you would use your calculator to strongly suggest that the statement IS an identity. Notice my change in wording... Can't you use your calculator's graphing (or tables) tools to prove that an equation is an identity? You'll need to address that also.
In sum:
a. Find an equation that is not an identity. Use your calculator to demonstrate that it's not an identity. Be creative. Take screen shots, pictures, images, etc.
b. Find an identity. Use your calculator to show what an identity looks like on the screen. Be creative. Take screen shots, pictures, images,etc.
c. Why can you not prove an identity using the graphing or tables tools? Explain.
Fourth Dimension
In class, we began a brief conversation about the tesseract or the hypercube. It's amazing how simple transformations can create such a powerful concept. In this blog, you have an opportunity to think about this more deeply or see some beautiful images.
Here are a couple links for fourth dimension discussion:
High School Student Discussion. (This is an academic discussion by a bright high school student, dry in imagry, but with some great ideas.
Forget about your familiar world. (This could simply blow your mind with the simplex, It's 14 minutes that just keeps getting more and more interesting. Watch the first 8 minutes then I challenge you to just try to stop the video. At 9 minutes you have the hypercube. )
And here's someone's story of building a visual or a double-rotation of a tesseract. It has a great set of visuals.
For those of you who say, "Hey, this could be a process for finding more than the 4th dimension..." Here's an image:
To blow your 1-dimensional mind further: here's a 2-dimensional image of a 4-dimensional shape represented in 3-dimensions casting a 2-dimensional shadow.
OR, find your own resource for thinking about a tesseract or hypercube or the 4th dimension (Please, no Dr. Who links....keep this mathematical.)
I hope this is fun for you; please keep asking yourself the "Why?" or "How?" questions so you can delve a little more deeply into your blog. Find something fun or interesting and write about it. Let is be recreational!
Here are a couple links for fourth dimension discussion:
High School Student Discussion. (This is an academic discussion by a bright high school student, dry in imagry, but with some great ideas.
Forget about your familiar world. (This could simply blow your mind with the simplex, It's 14 minutes that just keeps getting more and more interesting. Watch the first 8 minutes then I challenge you to just try to stop the video. At 9 minutes you have the hypercube. )
And here's someone's story of building a visual or a double-rotation of a tesseract. It has a great set of visuals.
For those of you who say, "Hey, this could be a process for finding more than the 4th dimension..." Here's an image:
To blow your 1-dimensional mind further: here's a 2-dimensional image of a 4-dimensional shape represented in 3-dimensions casting a 2-dimensional shadow.
OR, find your own resource for thinking about a tesseract or hypercube or the 4th dimension (Please, no Dr. Who links....keep this mathematical.)
I hope this is fun for you; please keep asking yourself the "Why?" or "How?" questions so you can delve a little more deeply into your blog. Find something fun or interesting and write about it. Let is be recreational!
Geo/Algebra II,Due 10/20/2016: Fourth Dimension
In class, we began a brief conversation about the tesseract or the hypercube. It's amazing how simple transformations can create such a powerful concept. In this blog, you have an opportunity to think about this more deeply or see some beautiful images.
Here are a couple links for fourth dimension discussion:
High School Student Discussion. (This is an academic discussion by a bright high school student, dry in imagry, but with some great ideas.
Forget about your familiar world. (This could simply blow your mind with the simplex, It's 14 minutes that just keeps getting more and more interesting. Watch the first 8 minutes then I challenge you to just try to stop the video. At 9 minutes you have the hypercube. )
OR, find your own resource for thinking about a tesseract or hypercube or the 4th dimension (Please, no Dr. Who links....keep this mathematical.)
I hope this is fun for you; please keep asking yourself the "Why?" or "How?" questions so you can delve a little more deeply into your blog. Find something fun or interesting and write about it. Let is be recreational!
Here are a couple links for fourth dimension discussion:
High School Student Discussion. (This is an academic discussion by a bright high school student, dry in imagry, but with some great ideas.
Forget about your familiar world. (This could simply blow your mind with the simplex, It's 14 minutes that just keeps getting more and more interesting. Watch the first 8 minutes then I challenge you to just try to stop the video. At 9 minutes you have the hypercube. )
OR, find your own resource for thinking about a tesseract or hypercube or the 4th dimension (Please, no Dr. Who links....keep this mathematical.)
I hope this is fun for you; please keep asking yourself the "Why?" or "How?" questions so you can delve a little more deeply into your blog. Find something fun or interesting and write about it. Let is be recreational!
Friday, September 16, 2016
Without Trig, your House Would be Lopsided.
This blog post follows the "Grade of the Road" post; you'll want to read that one first. Some of you have commented on this blog last year already (hopefully, you will remember that blog.) If you have not, take a minute to evaluate what trig function (using the angle of elevation) is the slope (or grade) of the road. Professionals who work on roads use the word "grade" to refer to the steepness of the slope of a road.
Professionals constructing roofs use the word "pitch" instead of "grade." Clearly to understand grade, pitch, and their relationship to each other, one must have more than a simple understanding of the basic trigonometric function called "tangent" and the algebraic concept of "slope" that you've learned in previous classes.
The pitch of a roof is described the following way. If a plan calls for a 11/18 pitch roof, then the roof rises 11 inches for every 18 inches of horizontal. (Horizontal is "run" in the image shown.)
Find the angle of elevation in the 11/18 pitch. Then discuss the relationship between "pitch," "grade" of a road and "slope." Furthermore, what does "tangent" have to do with "pitch," "grade" and "slope"?
Then find the full length of the total rise and the "rafter line" (refer to the illustration above) if the full length of the "run" of the rafter is 22 feet. You'll need to think about similar triangles.
Your blog needs to (a) stand alone, that is, not require your reader to read JammnPeaches. (b) be written in complete sentences (c) complete the math with explanations in English.
There's more cool math and geometry in these constructions, particularly when there's gables or two different pitches involved in a single house. If you'd like to explore this OYO or in a blog post, feel free to do so. The reference below is excellent for this blog and for your future studies. If you have Geometer's Sketchpad, then you can see the sketchpad illustration of the "valley" between two roofs of different pitches.
reference:
http://jwilson.coe.uga.edu/EMAT6680Su09/King/Roofing/Application%20of%20%20Mathematics%20in%20Construction.htm
Professionals constructing roofs use the word "pitch" instead of "grade." Clearly to understand grade, pitch, and their relationship to each other, one must have more than a simple understanding of the basic trigonometric function called "tangent" and the algebraic concept of "slope" that you've learned in previous classes.
The pitch of a roof is described the following way. If a plan calls for a 11/18 pitch roof, then the roof rises 11 inches for every 18 inches of horizontal. (Horizontal is "run" in the image shown.)
Find the angle of elevation in the 11/18 pitch. Then discuss the relationship between "pitch," "grade" of a road and "slope." Furthermore, what does "tangent" have to do with "pitch," "grade" and "slope"?
Then find the full length of the total rise and the "rafter line" (refer to the illustration above) if the full length of the "run" of the rafter is 22 feet. You'll need to think about similar triangles.
Your blog needs to (a) stand alone, that is, not require your reader to read JammnPeaches. (b) be written in complete sentences (c) complete the math with explanations in English.
There's more cool math and geometry in these constructions, particularly when there's gables or two different pitches involved in a single house. If you'd like to explore this OYO or in a blog post, feel free to do so. The reference below is excellent for this blog and for your future studies. If you have Geometer's Sketchpad, then you can see the sketchpad illustration of the "valley" between two roofs of different pitches.
reference:
http://jwilson.coe.uga.edu/EMAT6680Su09/King/Roofing/Application%20of%20%20Mathematics%20in%20Construction.htm
Subscribe to:
Posts (Atom)